Your Dev/Ops teams need to know why a performance blocker comes from the application itself, CPU availability, database loads, or something else entirely unexpected. You also need to optimize app performance wherever possible.
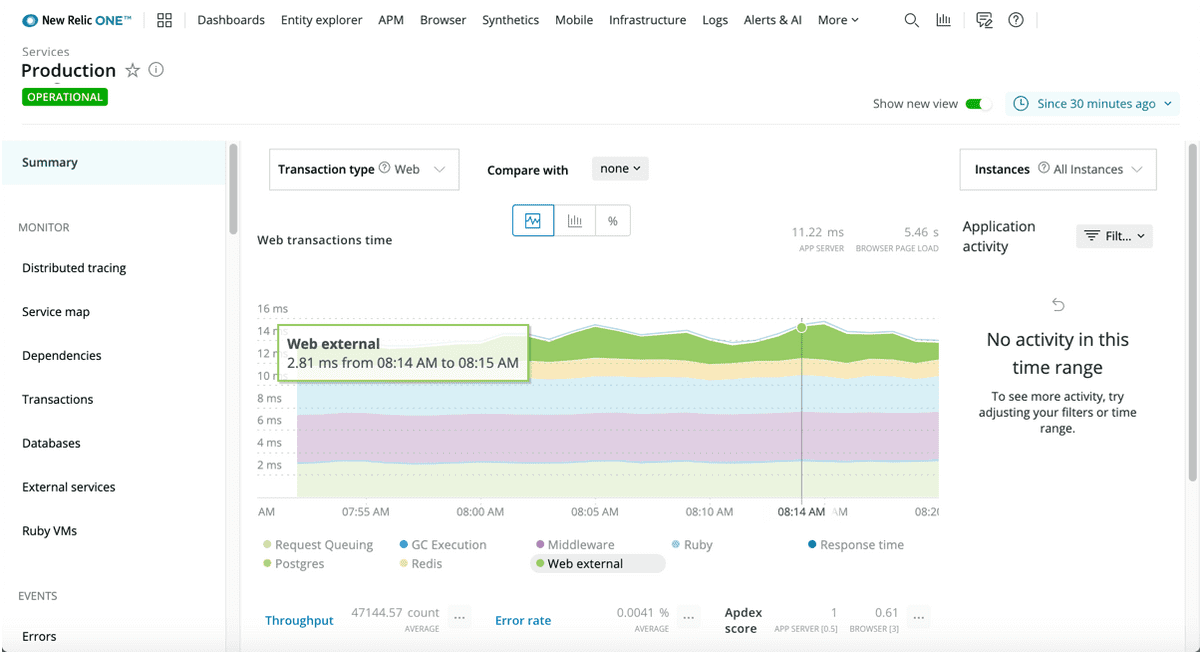
With New Relic's Application Performance Monitoring (APM), you have real-time and trending data about performance for your web apps and processes (non-web apps). In addition, with New Relic One, you can correlate your app's related services, alerts, logs, your infrastructure, and your corresponding mobile app experience.
Don't just monitor your data to get details about what's happening at a particular point of time. Instead, use the collective power of New Relic One to understand what to do with your detailed data, across your entire stack.
Get started.
- Learn about the wealth of APM data automatically available to you.
- Install your APM language agent from New Relic One, then start seeing actionable performance data in the APM UI.
- Monitor your own business-critical key transactions.
Analyze current state.
- Use real time streaming to query and visualize data in near real time.
- Monitor your apps and related hosts as a color-coded health map.
- Review deployment impacts in our UI or REST API.
Troubleshoot and resolve problems.
- Use alerts and Applied Intelligence for key performance indicators.
- Track down abnormal app performance with transaction traces, distributed tracing, and slow database queries.
- Find and fix errors with error analytics tools and profiles of error trends.
Optimize your apps.
- Improve user satisfaction levels (Apdex) on your app's frontend and backend.
- Get comparative data about app performance with your summary page's Compare with option.
- Compare your app's performance to the webpage lifecycle, browser-side traces, or host and server resources.
Get actionable data.
- Query any data type (including metrics, events, logs, and traces) via UI or API.
- Add custom values to query the exact data you need.
- Review service level agreement (SLA) reports and other performance reports to find areas for improvement.
Visualize your data.
- Create and share a variety of charts and dashboards that include customer context with business priorities and expected outcomes.
- Add custom values to your queries.
- Examine architectural connections and dependencies with service maps.
