Full-Stack Observability is the power of knowing what’s happening in your digital system, and why, at any time. Our solutions give you the whole picture of the hundreds of applications and services you run simultaneously, and allow you to give context to the performance of your system.
Use our tools to visualize, analyze, and troubleshoot your entire software stack in one connected interface. You'll get rich analytics, coupled with a curated user experience.
No credit card required. Already have an account? Login.
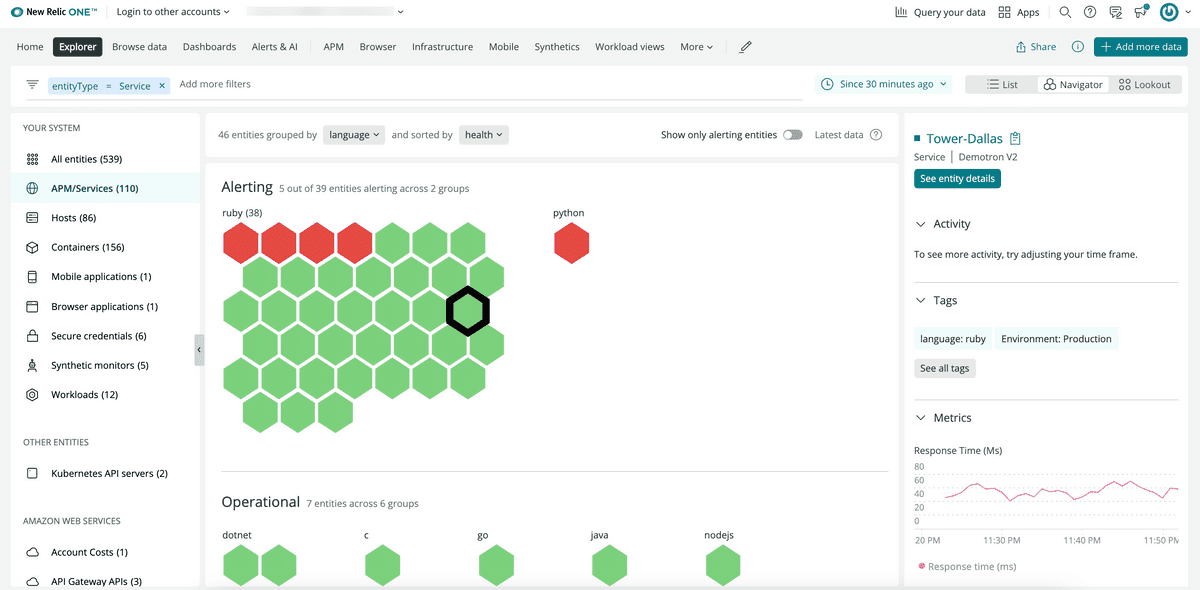
one.newrelic.com > New Relic Explorer: Your full stack, at a glance.
Get started.
Use our Full-Stack Observability platform to see your entire stack in one unified platform.
Explore your entities.
Browse and filter your system’s entities to quickly find issues and spot connections.
Monitor your infrastructure.
Instrument your entire infrastructure, from services in the cloud to services on dedicated hosts to containers in Kubernetes.
Track requests with Distributed Tracing.
See and follow your requests’ entire journey from start to finish as they travel through distributed systems.
Access all your logs.
Use our log management platform to connect your logs with the rest of your telemetry and infrastructure data.
Simulate traffic with Synthetics.
Imitate user traffic around the world with real browsers so you can detect and resolve performance issues before your customers notice.
