Pinpoint and solve issues down to the line of code with Node monitoring from New Relic. With features like service maps and error analytics, New Relic for Node.js allows you to get the full picture of your app environment.
Monitor your Node.js data from curated dashboards in APM, browser monitoring and other New Relic capabilities.
Enable distributed tracing to get visibility into modern distributed architectures.
To keep your agent up to date and ensure you have access to the latest features, see the Node.js agent release notes.
No credit card required. Already have an account? Login.
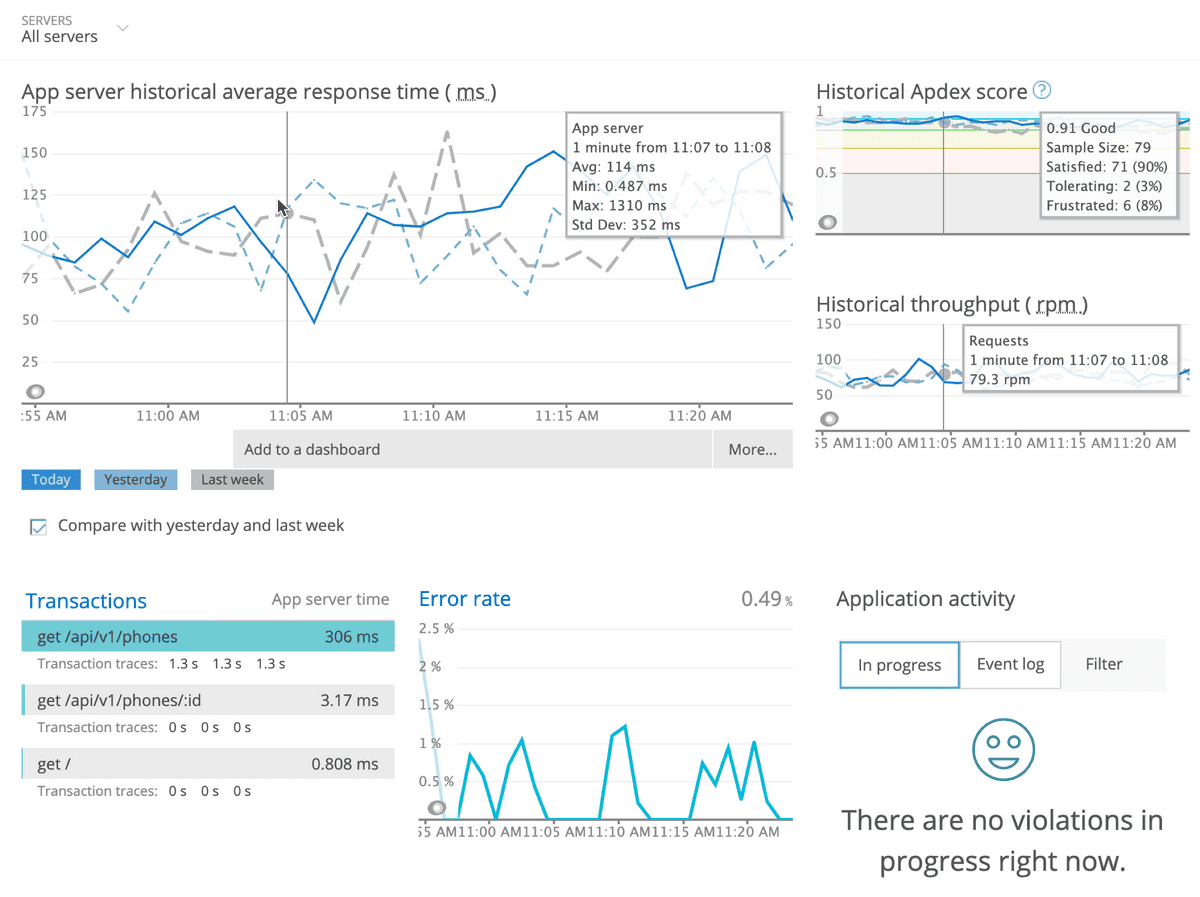
one.newrelic.com > APM > (select an app) > Overview: The APM Overview page includes charts and tables showing your Node.js app's performance at a glance, plus links to end user performance in our browser monitoring, hosts monitored by our infrastructure monitoring, and more.
Get started.
Discover Node.js agent capabilities and how to get up and running.
Install the Node.js agent.
Follow standard installation procedures on supported to install the New Relic Node.js agent.
Configure the agent.
You can configure the agent by editing your newrelic.js config file, or by setting an environment variable.
Customize.
Tailor your agent instrumentation with custom instrumentation and custom metrics.
Node.js agent API.
Use the agent API to extend your instrumentation.
Troubleshoot common problems.
See the full list of troubleshooting documentation for help with common issues.
